
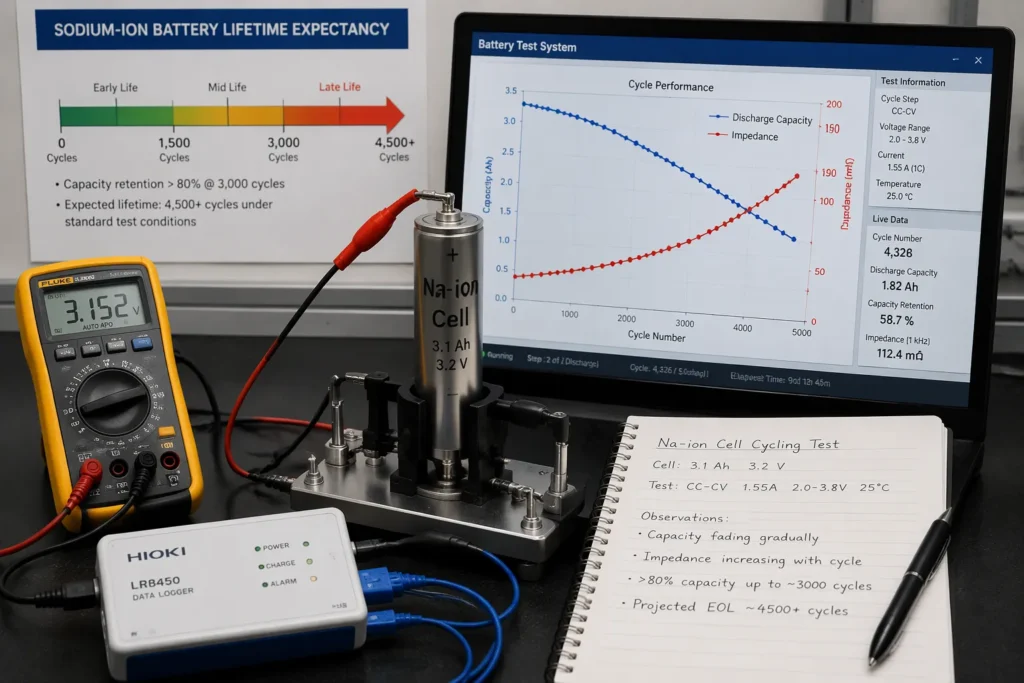
Sodium-ion batteries age through three linked phenomena: capacity fade, impedance growth and a finite lifetime expectancy. Capacity fade describes the gradual loss of usable charge a cell delivers. Impedance growth means the cell’s internal resistance rises, so each charge and discharge becomes harder. Lifetime expectancy is the total service a cell provides before it no longer meets its duty. These sodium-ion battery aging mechanisms share common causes, and each one is measurable in the laboratory. Understanding them helps engineers predict how long sodium-ion batteries will last in real installations. This post links every mechanism to its causes, its measurement and its practical implications for system designers.
Key Takeaways
Capacity fade reduces the charge a battery holds, and impedance growth makes it harder for the battery to deliver power.
SEI growth and particle cracking are key causes of ageing, and they link capacity loss with rising resistance.
Calendar ageing happens during storage, and high temperature and high charge speed up this process.
The parabolic law and Arrhenius equation help engineers predict how batteries age over time and temperature.
You can extend battery life by storing at moderate charge, keeping batteries cool, and using gentle charging.
Sodium-Ion Battery Aging Mechanisms Explained
Capacity Fade and Impedance Rise
Capacity fade and impedance rise stand as the two principal measurable effects of ageing in sodium-ion batteries. Capacity fade is the decline in the charge a cell can store and release over its service life. Impedance rise is the increase in the cell’s internal resistance to the flow of ions and electrons. Laboratory tests track both effects directly. A capacity test records the usable charge at a fixed current. An impedance measurement, often taken by electrochemical impedance spectroscopy, records the resistance across a range of frequencies. Together, these two readings describe the health of a cell far better than either one alone.
The consequences of ageing reach every part of a system. A cell with capacity fade delivers less energy, so runtime shortens. A cell with impedance rise produces more heat and wastes more energy as losses, so efficiency falls. Higher internal resistance also limits the power the cell can supply on demand. System designers therefore see shorter runtime, weaker peak power and greater thermal load as a battery pack matures. These effects compound in a pack, where the weakest cell can constrain the whole string.
Why Ageing Matters for Cost and Usability
Ageing studies underpin lifetime modelling, and lifetime modelling underpins cost-effectiveness. A supplier who can predict how capacity fade and impedance rise progress over years can size a pack correctly from the start. An oversized pack wastes money and materials. An undersized pack fails its duty early. Accurate models of the aging mechanisms of sibs allow designers to match pack size to the real duty cycle and to the expected service window.
Cost calculations depend on these predictions. The levelised cost of storage spreads the purchase price across the energy a system delivers over its life. A pack that degrades faster delivers less energy, so each unit of delivered energy costs more. Reliable data on the degradation mechanisms of sibs and libs lets buyers compare options on a fair basis. This data also guides warranty terms and replacement schedules. Sound ageing science therefore turns a vague promise of long life into a number a project can budget against.
Capacity Fading Mechanisms in Sodium-Ion Cells
Reversible Versus Irreversible Loss
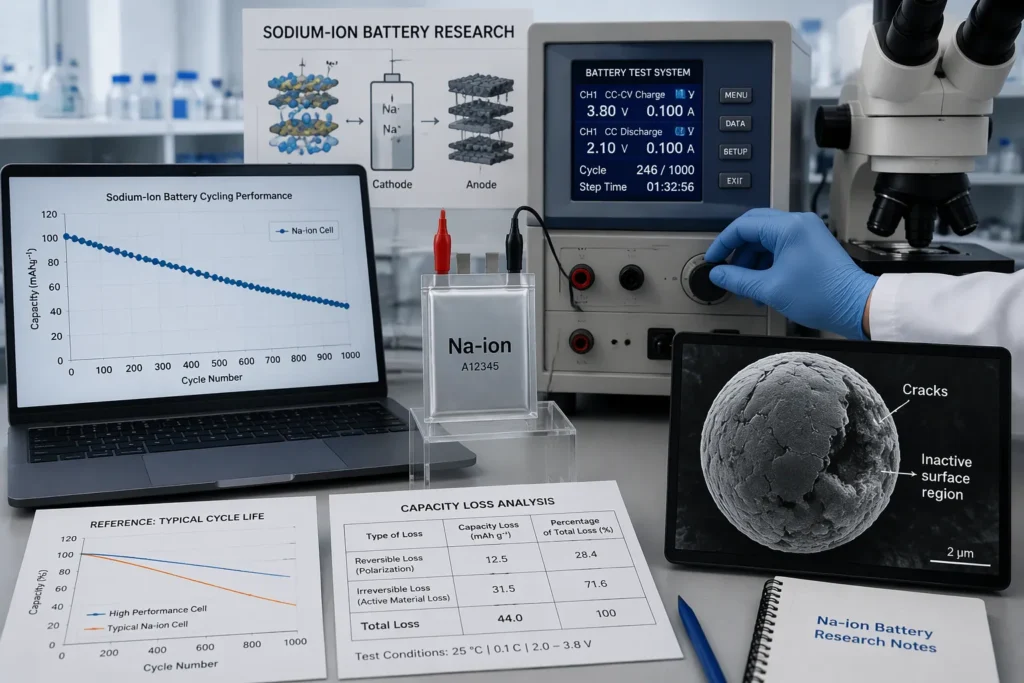
Capacity fading mechanisms fall into two broad classes, and the distinction matters for anyone diagnosing a pack. Reversible capacity loss returns after a rest period or a gentle reconditioning cycle. A cell that appears weak after fast charging may recover much of its charge once it rests and warms. Irreversible capacity loss never returns. The charge is gone for good, and the cell has permanently lost part of its storage.
The table below sets out the practical difference between the two.
Feature | Reversible loss | Irreversible loss |
|---|---|---|
Recovery | Returns after rest or reconditioning | Never returns |
Typical cause | Kinetic limitation, temporary polarisation | Structural damage, inventory consumed |
Diagnostic sign | Capacity recovers on a slow cycle | Capacity stays low on every cycle |
A gradual decrease in usable capacity across many cycles usually signals the irreversible kind. Test engineers therefore run a slow reference cycle before judging a cell, so that temporary effects do not distort the reading.
Loss of Active Material at the Cathode
Loss of active material at the cathode is arguably the dominant driver of capacity fade in commercial cells, especially at high state of charge. The cathode stores sodium ions in its crystal structure. Repeated extraction and insertion of those ions strains the lattice. At high state of charge, most of the sodium has left the structure, and the lattice becomes mechanically and chemically fragile. Particles crack, surfaces reconstruct into inactive phases, and some cathode material simply stops participating in the reaction. Each of these processes removes storage sites, so capacity loss accumulates.
Cathode material degradation therefore sits at the centre of most lifetime studies on sodium-ion batteries. The effect grows with the depth of charge and with the time a cell spends near full charge. A pack held at high state of charge for long periods loses cathode capacity faster than one cycled around mid-charge.
Manganese dissolution causes rapid fade in some systems. Certain cathode chemistries contain manganese, and this element can dissolve into the electrolyte under aggressive conditions. The dissolved manganese migrates, deposits elsewhere, and damages the opposing electrode. Capacity fading mechanisms of this type can progress quickly, and they show up as a steep decline rather than a gentle slope. Designers of sodium-ion batteries watch for this signature closely, because it changes the lifetime calculation. Cells built on more stable cathode chemistries avoid the problem, and each chemistry carries its own trade-offs in cost, energy density and durability. Prismatic and cylindrical sibs in commercial service show these patterns clearly, and the degradation pathway differs by chemistry rather than by format alone.
The Aging Mechanism of Sodium-Ion Batteries at the Interface
SEI Growth and Sodium Inventory Loss
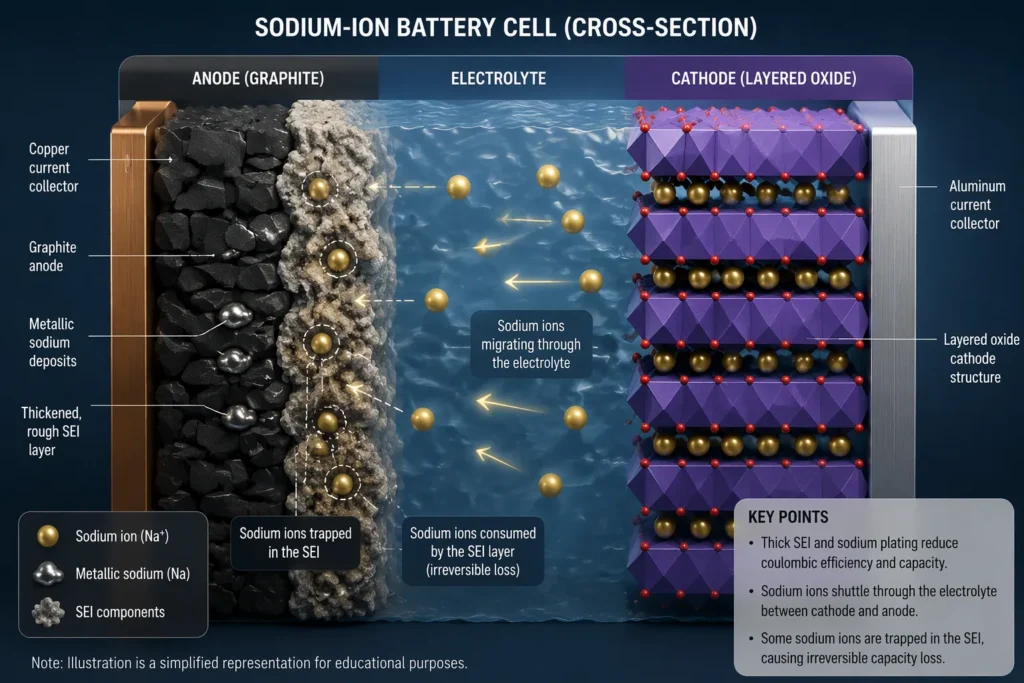
The anode-electrolyte interface is where much of the ageing action happens in a sodium-ion cell. On first charge, electrolyte components break down on the anode surface and form a passivating film called the solid electrolyte interphase. This film protects the electrolyte from further attack, and a stable film is essential for long life. The trouble is that the film does not stay still. It continues to thicken slowly over time, and every bit of thickness consumes sodium that would otherwise carry charge. This is the core of sei growth: a self-limiting but persistent process that steadily drains the cell’s sodium inventory.
Sodium inventory loss is the direct consequence. The cell contains a fixed amount of sodium, and any sodium locked into the growing sei layer can no longer shuttle between the electrodes. Capacity loss follows almost mechanically. A thicker sei layer also lengthens the path ions must travel, so resistance climbs alongside the capacity decline. These anode-side interfacial reactions therefore link the two headline symptoms of ageing in a single mechanism. Engineers who track film thickness and inventory loss together gain a clearer picture of remaining life than either measurement alone provides.
Metal Plating and Particle Cracking
Metal plating is a second interfacial hazard. Under fast charging or low temperature, sodium ions can deposit as metallic sodium on the anode surface instead of intercalating into the host material. Plated metal reacts readily with the electrolyte, and the reaction products add fresh material to the sei layer. The plated sodium is effectively lost, so capacity falls. In lithium-ion systems, lithium plating follows a comparable pathway, and the comparison helps researchers interpret sodium behaviour without implying that one chemistry is superior. Each chemistry manages plating risk through its own cell design and charging limits.
Particle cracking completes the picture. Volume changes during cycling fatigue the active particles, and cracks expose fresh surfaces to the electrolyte. New surface means new sei growth, and the cycle repeats. Cracks can also isolate fragments of active material from the electronic network, which raises resistance and removes storage sites. The degradation pathway therefore runs through both electrodes and through the electrolyte itself. Prismatic and cylindrical sibs both show this pattern, and the severity depends on the chemistry, the electrode design and the duty cycle rather than on the cell format. Together, plating and cracking explain why capacity loss often accelerates late in life, when the sei layer is thick and the particles are already weakened.
Calendar Aging in Standby Conditions
Side Reactions During Storage
Sodium-ion batteries spend most of their service life in standby. A cell in a parked vehicle, a grid buffer or a backup cabinet rests for weeks between active periods. Rest does not stop the chemistry. Internal side reactions continue at the interface, and they consume sodium inventory and electrolyte without any current flowing. This slow process is calendar aging, and it produces irreversible capacity fade that no reconditioning cycle can recover.
Test data from aged cells show a clear pattern. Cell capacity decreases roughly linearly with time during storage. The decline does not level off, and it does not depend on cycling at all. Calendar aging therefore sets a floor on service life, even for a pack that sees very little use. A system designer who plans only for cycle life will overestimate the years a battery delivers.
Temperature and State-of-Charge Effects
Storage temperature is the strongest lever on calendar aging. Cell capacity falls faster at higher storage temperatures, and the effect is substantial rather than marginal. A pack stored in a warm room ages more quickly than an identical pack stored in a cool one. Long-term calendar aging studies therefore report storage temperature alongside every result, and comparisons across studies are only fair when temperatures match.
State of charge matters just as much. A high state of charge accelerates cathode degradation, because the cathode lattice is most fragile when most of its sodium has left. Calendar aging at full charge therefore runs faster than calendar aging at mid-charge. Operators of sodium-ion batteries and sibs in standby duty can slow degradation simply by storing packs at a moderate state of charge in a controlled thermal environment. Both levers cost little, and both extend the window before capacity loss becomes visible in service.
Causes of Impedance Growth
Interfacial Film Thickening
Interfacial films sit between the electrode and the electrolyte, and their thickness governs how easily ions cross that boundary. On the anode, sei growth builds a film that thickens steadily over time. A thicker sei layer forces sodium ions to travel a longer path, and this added path length shows up directly as increased internal resistance. The same principle applies at the cathode, where surface reconstruction and deposited reaction products add a resistive skin. Each new layer of film therefore compounds the problem, and the cell delivers less power for the same voltage window.
The mechanism links back to the anode-side interfacial reactions described earlier. Every reaction that adds material to the film also adds resistance. Test engineers see this as a rising semicircle in an impedance spectrum, and they read the width of that feature as a measure of film resistance. A cell with a thin, stable film keeps its power capability. A cell with a thick, growing film loses it gradually.
Electrolyte Depletion and Contact Loss
Electrolyte depletion is the second major cause. The electrolyte carries ions between the electrodes, and side reactions consume it over time. A shrinking electrolyte volume raises the concentration gradient that ions must overcome, and this effect adds to sodium ion diffusion impedance inside the porous electrodes. Once the electrolyte runs short in a local region, that region stops contributing current, and the effective electrode area shrinks.
Loss of particle-to-particle contact completes the picture. Volume changes during cycling push particles apart, and cracks sever the electronic pathways that bind the electrode together. The result is a rise in impedance rise across the whole cell, not just at one interface. Sodium-ion batteries in hard cycling duty show this pattern most clearly, and sibs in standby duty show it more slowly. The practical outcome is the same in both cases: reduced power capability, lower round-trip efficiency and more heat per cycle. Designers of sodium-ion batteries therefore treat impedance growth as a power limit, not merely an efficiency penalty.
Modelling Ageing: Parabolic Law and Arrhenius Equation
The Parabolic Law for SEI-Limited Growth
The parabolic law describes sei growth as a diffusion-limited process. Fresh electrolyte must diffuse through the existing film to reach the anode surface, and the film thickens as a result. A thicker film slows that diffusion, so the growth rate falls over time. The film thickness therefore rises with the square root of time, and the capacity lost to film formation follows the same curve. Early life brings fast growth, and later life brings slow growth.
This model gives engineers a practical tool. A short laboratory test can fit the early part of the curve, and the fit then projects film thickness years ahead. The parabolic law suits cells whose fade is dominated by interfacial film formation. It fits poorly when particle cracking or plating drives the loss, so analysts check the fit before trusting a projection. Pairing the model with electrochemical impedance spectroscopy under temperature disturbances confirms whether film resistance follows the expected curve.
Temperature Dependence via Arrhenius
The Arrhenius equation supplies the temperature term for every ageing model. Reaction rates rise exponentially with temperature, and the equation captures that rise through an activation energy. A higher activation energy means the process responds more sharply to heat. Analysts plot ageing rate against inverse temperature, and a straight line on that plot confirms Arrhenius behaviour.
The equation also links the models together. The parabolic law sets the shape of fade over time, and the Arrhenius equation sets how fast that shape unfolds at a given temperature. Calendar aging tests at elevated storage temperatures often show fade that is linear with time rather than parabolic. This linear behaviour complements the two models, and it signals that a different limiting process dominates during storage. Together, the three observations give a fuller picture of calendar aging across real duty profiles.
How Capacity Fade and Impedance Growth Interact
Shared Drivers, Coupled Trajectories
Capacity fade and impedance growth rarely travel alone. Both effects spring from the same underlying processes at the electrode surfaces. SEI growth consumes sodium inventory and thickens the interfacial film at the same time. One process removes usable charge, and the other adds resistance. Particle cracking follows a similar pattern. Each crack exposes fresh surface, and fresh surface feeds new film growth. The crack also severs electronic contact, which raises resistance and strands active material. A single event therefore drives both symptoms forward.
This shared origin explains why the two curves move together in test data. A cell that loses capacity quickly usually shows a fast rise in resistance as well. Engineers who track only one symptom miss half of the story. The aging mechanism of sodium-ion batteries is best read as one coupled process with two visible outputs.
Cycling Versus Calendar Contributions
Total battery degradation splits into two streams. Cycling wear accumulates with every charge and discharge, and it scales with throughput, depth of discharge and current rate. Calendar aging accumulates with time in storage, and it scales with temperature and state of charge. The two streams add together over a service life.
Factor | Cycling contribution | Calendar contribution |
|---|---|---|
Main driver | Current flow, volume change | Resting side reactions |
Key levers | Rate, depth, temperature | Storage temperature, state of charge |
Typical signature | Accelerating capacity loss late in life | Steady, roughly linear decline |
A pack in daily deep cycling leans on the first stream. A backup pack that rests for months leans on the second. Most real duties mix both, so analysts separate the streams before projecting life. Sodium-ion batteries in grid buffer duty illustrate the point well. Their capacity fade comes mostly from calendar aging, and their impedance rise follows the same slow path.
Lifetime Expectancy of Sodium-Ion Batteries
Cycle Life and Calendar Life Benchmarks
Published benchmarks for sodium-ion batteries describe long service, yet the figures vary widely between chemistries and cell designs. Cycle-life claims commonly reach into the thousands of full cycles before capacity retention falls to a stated threshold. Calendar-life claims extend across multiple years of standby service. Readers should treat both figures as indicative rather than guaranteed. A benchmark reflects one cell, one test protocol and one set of conditions. A pack in the field meets none of these exactly.
Test houses report cycle life at a fixed depth of discharge and a fixed temperature. They report calendar life from storage tests at elevated temperature, then extrapolate to service conditions. The extrapolation carries uncertainty, and honest datasheets state the test conditions alongside the number. A temperature-resistant state of health estimation method helps operators track the real decline against the benchmark, because it corrects for the thermal history a pack actually experiences.
Operating Conditions That Shift Lifetime
Three operating factors move expected lifetime more than any other. Temperature ranks first. Heat accelerates every side reaction, so a warm pack ages faster than a cool one. State of charge ranks second. Storage at high charge speeds cathode degradation and accelerates calendar aging. Cycling rate ranks third. Fast charging raises local stress and plating risk, and it shortens the usable capacity over long-term cycling.
Factor | Direction of effect | Practical lever |
|---|---|---|
Temperature | Higher heat shortens life | Thermal management, cool storage |
State of charge | High charge accelerates calendar aging | Store at moderate charge |
Cycling rate | Fast charge adds stress | Moderate charge rates where duty allows |
A standard state of health estimation method lets an operator confirm how much life each factor has consumed. Sodium-ion batteries in mild, moderate-charge duty therefore deliver the longest service, and sodium-ion batteries in hot, fast-charge duty deliver the shortest.
Mitigating Ageing in Practice
Materials and Electrolyte Design
Materials design attacks ageing at its source. Surface coatings on cathode particles shield the lattice from direct electrolyte contact, and this barrier slows the surface reconstruction that removes storage sites. Doping the cathode structure with stable elements strengthens the lattice against the strain of repeated sodium extraction. Both levers target structural degradation directly, and both suit cells that must hold a high state of charge for long periods.
Electrolyte formulation offers a second route. Additives that decompose early can build a thin, stable sei layer before the bulk electrolyte reacts. A well-formed film limits further sei growth and protects the sodium inventory. Alternative salts and solvent blends raise the temperature at which side reactions accelerate. These choices suit different duties: coatings favour high-energy cathodes, and electrolyte additives favour cells that cycle hard or rest warm. No single combination wins everywhere, so designers match the package to the duty cycle.
Operational Strategies for Longer Life
Operating choices extend life without changing the cell. Storage at a moderate state of charge slows cathode degradation and limits calendar fade. Thermal management keeps packs within a mild temperature band, and this single lever reduces the rate of every side reaction. Moderate charge rates lower plating risk and local stress during cycling.
These strategies fit different settings. Stationary sibs in standby duty benefit most from cool storage at mid-charge. Vehicle packs gain most from active cooling during fast charging. Operators of sodium-ion batteries should pair each measure with state of health tracking, so the effect becomes visible. Sodium-ion batteries in mild duty therefore reach their benchmark life with modest effort.
Sodium-ion battery aging mechanisms resolve into three connected ideas. Capacity fade and impedance growth act as measurable symptoms of shared degradation at the electrode surfaces. Lifetime expectancy is their practical outcome. The parabolic law shapes film-limited fade over time, the Arrhenius equation sets its temperature dependence, and calendar-ageing observations complete the picture for standby duty. Together, these tools let engineers predict how sodium-ion batteries will behave across real duty profiles. Mitigation follows the same logic. Materials, electrolytes and operating strategy each slow the underlying processes, and sodium-ion batteries that combine all three levers reach their benchmark service life with confidence.
FAQ
What is the difference between capacity fade and impedance growth in sodium-ion batteries?
Capacity fade reduces the charge a cell stores and releases. Impedance growth raises internal resistance, so the cell delivers less power and wastes more energy as heat. Both effects share the same underlying causes at the electrode surfaces, and test engineers measure them separately to judge cell health.
What causes capacity fade in sodium-ion batteries?
Loss of active material at the cathode drives most fade in commercial cells, particularly at high state of charge. SEI growth consumes sodium inventory at the anode. Manganese dissolution causes rapid fade in some cathode chemistries. Particle cracking and metal plating add further losses, and calendar aging contributes during storage.
How does storage affect the lifetime of a sodium-ion battery?
A resting cell still ages. Side reactions at the interface consume sodium and electrolyte, and capacity falls roughly linearly with time. Higher storage temperature speeds this decline, and a high state of charge accelerates cathode degradation. Cool storage at moderate charge therefore extends service life.
What does the parabolic law tell engineers about sodium-ion battery ageing?
The parabolic law models SEI growth as a diffusion-limited process. The film thickens with the square root of time, so early life brings fast growth and later life brings slow growth. Engineers fit the early curve from short tests and project film thickness years ahead.
How can operators extend sodium-ion battery life in practice?
Surface coatings and electrolyte additives slow film growth and protect the cathode lattice. Operators should store packs at moderate charge, keep them within a mild temperature band and avoid unnecessary fast charging. State of health tracking confirms how much life each measure preserves.