
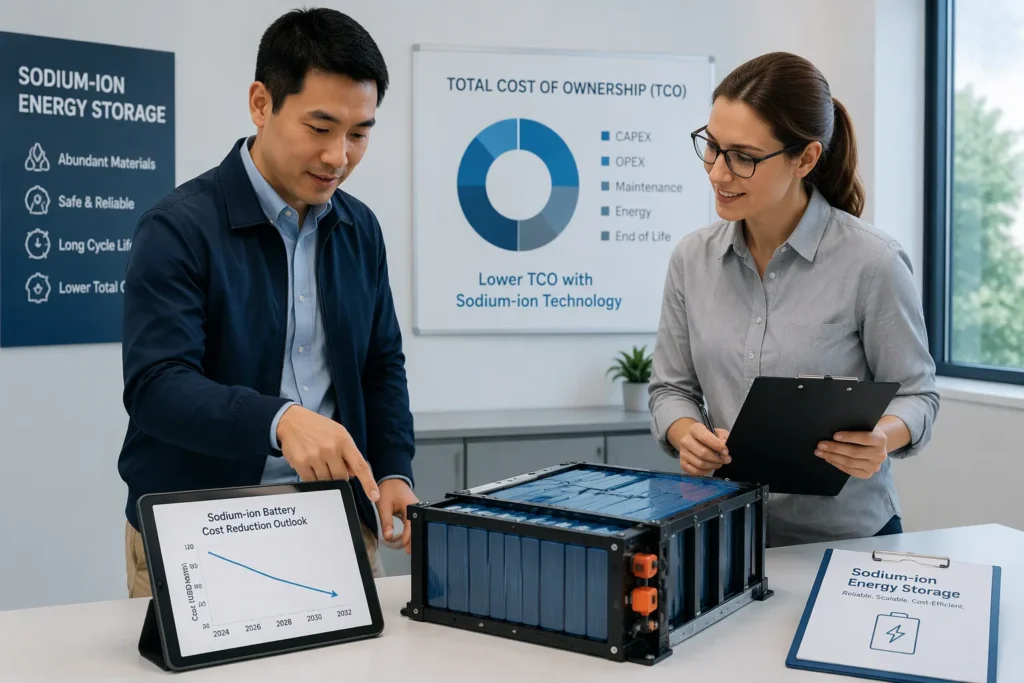
Sodium-ion batteries can cut lifetime ownership costs even when the purchase price is higher. Project costs over the full holding period often fall below those of alternative chemistries. This makes reducing total cost of ownership (TCO) the correct lens for B2B battery procurement, not cell price alone. Purchase costs reveal little about operation, maintenance or replacement over a decade of service. Three deliverables follow: a four-pillar TCO framework, a fair comparison with lithium-ion and lead-acid, and an assess–pilot–scale implementation path.
Key Takeaways
Compare batteries on total cost of ownership, not just purchase price.
Use four cost pillars: acquisition, operation, maintenance, and end-of-life.
Sodium-ion batteries often cost less over their lifetime despite a higher upfront price.
Match sodium-ion batteries to depot-based fleets and repeated cycles for best results.
Start with a small pilot and scale up after checking real costs against your model.
Reducing Total Cost of Ownership (TCO): The B2B Case
Why Cell Price Misleads Buyers
Sophisticated B2B buyers now compare sodium-ion and lithium-ion batteries on lifetime economics rather than sticker price. A low purchase price offers little comfort when installation costs, maintenance requirements and replacement schedules erode the savings. Reducing total cost of ownership (TCO) captures every payment across the holding period. Cell price captures only the first one. The distinction matters for any organisation that holds assets for many years.
A battery that looks cheap at the quotation stage can carry hidden costs for a decade. Fleet operators who track only the unit cost often miss the wider picture. Routine maintenance visits, downtime and premature replacement all add to the bill. Maintenance teams also absorb diagnostic work that a low price never covers. A lithium-ion battery with a low headline price may still lose on lifetime value. Reducing total cost of ownership (TCO) therefore gives procurement teams a fair basis for comparison. The same logic applies when buyers weigh lithium-ion batteries against newer battery chemistries. A single price tag cannot show which battery suits a ten-year duty cycle. Finance teams should discount future payments to present value. This step turns a long list of outflows into one comparable figure.
The Four Cost Pillars
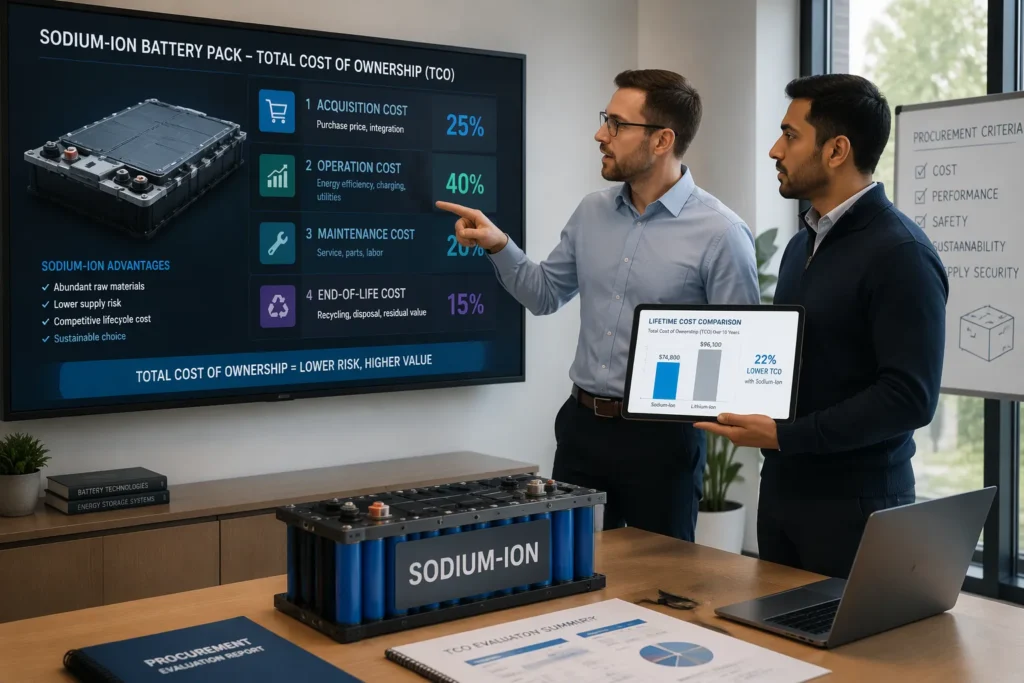
The total cost of ownership model rests on four pillars: acquisition, operation, maintenance and end-of-life. Acquisition covers the purchase price plus installation costs and commissioning. Operation covers energy losses, efficiency and operating costs across the service life. Maintenance covers inspection, servicing and replacement costs for worn components. End-of-life costs cover removal, transport and recycling or resale. Each pillar applies to every battery pack under review. Commissioning checks, grid connection fees and staff training belong in the first pillar. Energy losses and charging efficiency belong in the second.
Each pillar interacts with the others. A battery with a long cycle life may need fewer replacements, which lowers maintenance costs and total costs. A chemistry with stable performance may reduce service costs and downtime. Buyers should map every cash outflow to one pillar. This discipline exposes hidden costs that a simple price comparison conceals. A clear maintenance schedule and a realistic replacement plan keep the model honest. Maintenance planning also protects the battery asset against avoidable degradation. A simple spreadsheet can hold the model. The buyer lists each outflow, assigns a year and applies a discount rate.
The framework also supports fair comparisons. Lithium-ion batteries and lead-acid batteries each fit specific roles. Lead-acid batteries suit low-cost standby duties. Lead-acid batteries remain competitive where weight matters little. Sodium-ion batteries offer a third path. A buyer who applies the four pillars can see where each option fits best. The model does not favour one chemistry by default. It simply makes every cost visible. Predictive maintenance data, maintenance records and battery performance records strengthen the analysis over time. A lithium-ion battery comparison should follow the same rules, and battery choice should rest on evidence. The exercise takes a few hours and repays the effort many times over.
Breaking Down Sodium-Ion Costs
Acquisition and Installation Costs
Sodium-ion cells currently carry a higher upfront price than lithium iron phosphate (LFP) cells. The cell price gap sits at roughly 30%. Supply agreements already cover about 70 GWh of sodium-ion capacity, which signals growing confidence in the chemistry. Production scale explains much of the gap. As factories ramp up output, the per-unit cost falls. Optimised factory operations add a second saving. Better yields and steadier process control trim waste from every production run. Buyers should treat today’s premium as a temporary feature of a young supply chain, not a permanent penalty.
Installation costs deserve equal attention. A sodium-ion pack may need different racking, thermal management or commissioning work. These costs belong in the acquisition pillar alongside the invoice price. Buyers comparing quotes should request a full installed cost, not a cell price alone.
Operating, Maintenance and End-of-Life Costs
Sodium and iron are cheap and plentiful materials. This abundance reduces exposure to price volatility across the holding period. It also sets a lower structural cost floor for the chemistry. Those advantages compound. Every avoided downstream cost adds to the saving in later years. A fleet that spends less on servicing and replacement keeps more capital for core operations.
The operating case extends to real fleets. Electric forklifts and other materials handling equipment run predictable duty cycles, which suits sodium-ion behaviour. Operators of electric forklift trucks report that stable chemistry translates into low operating costs over time. The same logic supports lower maintenance costs for battery electric vehicles (BEV) in depot-based service. Fewer service interventions mean fewer maintenance hours and fewer maintenance costs overall. End-of-life handling completes the picture. Removal, transport and recycling costs vary by chemistry, and buyers should model them explicitly. Sodium-ion offers a credible route to competitive lifetime costs, provided the application matches the chemistry.
Sodium-Ion Versus Lithium-Ion and Lead-Acid
Performance and EHGV Application Fit
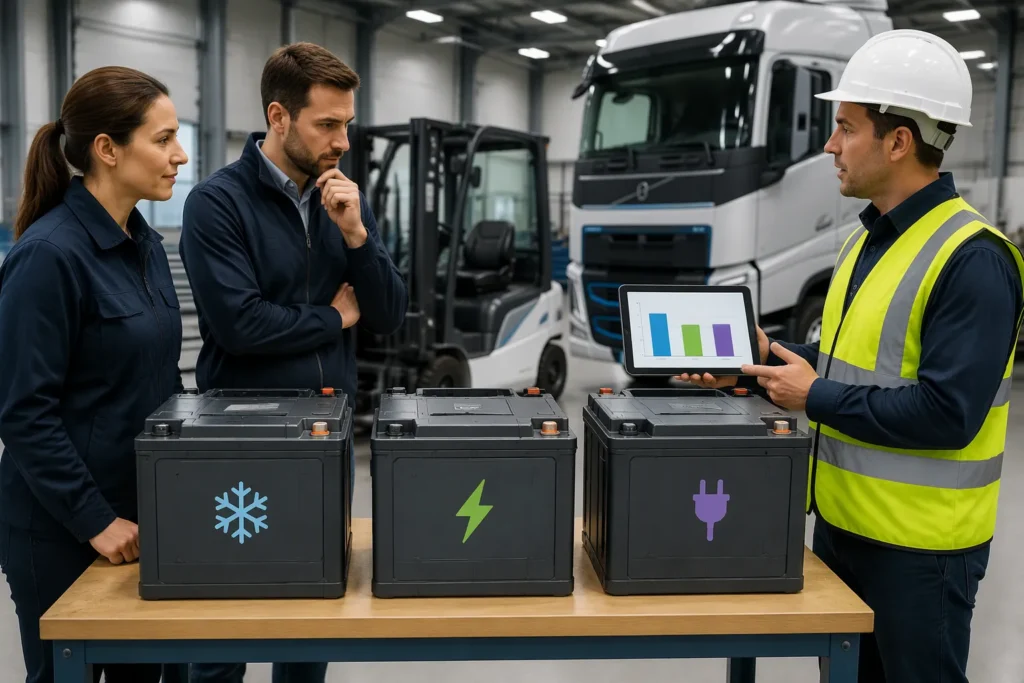
Each chemistry serves a distinct role. Lithium-ion batteries deliver high energy density and suit long-distance electric trucks and battery electric vehicles (BEV) with demanding range targets. Lead-acid batteries remain a low-cost choice for standby power and short-shift duties. Sodium-ion batteries sit between them. They offer stable performance, good cycle life and tolerance of wide temperature swings. A fleet manager should match the battery to the duty cycle, not to a headline specification.
Criterion | Sodium-ion | Lithium-ion | Lead-acid |
|---|---|---|---|
Upfront cell price | Higher than LFP | Competitive | Lowest |
Cycle life | Long | Long | Shorter |
Cold-weather behaviour | Strong | Good | Weaker |
Best fit | Depot-based fleets | Long-haul BEV | Standby duties |
Electric forklifts and other materials handling equipment run predictable, repeated cycles. Sodium-ion handles this pattern well. Operators of electric forklift trucks value steady output across a full shift. The same holds for forklift trucks in cold stores. Battery technology of this kind also supports 24×7 logistics operations, where downtime carries a real price. Lithium-ion batteries still lead where payload and range dominate. Lead-acid batteries keep a place in low-utilisation sites.
EHGV Market Share and Compliance
Electric heavy goods vehicle fleets face tight route planning and fixed depot charging. Sodium-ion suits this profile. Rising EHGV market share pushes buyers to compare chemistries on lifetime economics. Growth in EHGV market share also strengthens the business case for EHGVs in urban and regional haulage. An EHGV fleet that charges at a depot can accept a heavier, cheaper pack. Regulatory compliance adds a further factor. Low-emission zone rules and fleet emission reporting favour any zero-tailpipe option, and sodium-ion meets those duties without rare materials.
The numbers explain the interest. The cell price gap sits near 30%, yet the lifetime total cost of ownership gap reaches roughly 50%. A twenty-year ownership model shows a 21% saving against alternatives. Lower maintenance costs and low operating costs drive that result. Fewer service visits cut maintenance hours, and stable chemistry cuts maintenance risk. Those avoided costs compound across the holding period. Buyers who weigh only the invoice miss this effect. Reducing total cost of ownership (TCO) analysis exposes it clearly.
Implementing Sodium-Ion: The Near-Term Decarbonisation Pathway
Fleet and facility managers can treat sodium-ion adoption as a near-term decarbonisation pathway. The chemistry removes tailpipe emissions at the point of use. It also rests on abundant materials, which supports steady supply as volumes grow.
Assessment and Piloting
The work starts with a baseline TCO assessment. The buyer lists every outflow across the four pillars and discounts each one to present value. This baseline covers the current fleet, whether it runs on lead-acid batteries or lithium-ion batteries. A fair baseline makes later savings measurable.
Application matching comes next. Depot-based routes, cold stores and repeated shift patterns suit the chemistry well. Electric forklifts and other materials handling equipment are strong candidates. Operators of electric forklift trucks can pilot a small pack set and record real duty cycles. The same approach works for electric trucks on fixed regional routes and for any hgv fleet with depot charging. A localised sodium-ion supply chain strengthens supply resilience and shortens lead times.
Scaling and Monitoring
Pilot-to-scale sequencing keeps risk low. The buyer expands pack numbers only after the pilot meets the modelled figures. Ongoing monitoring then compares real maintenance costs, operating costs and downtime against the TCO model. Maintenance teams log every service visit and every replacement. Discrepancies trigger a model review, not a rushed rollout.
Monitoring also tracks chemistry fit over time. A bev depot and a mixed fleet may need different pack sizes. Buyers should revisit the comparison with lithium-ion batteries and lead-acid batteries each year. The lithium-ion battery benchmark moves as prices shift. A disciplined review keeps the business case honest and protects the savings.
Sodium-ion batteries reduce total cost of ownership through competitive acquisition costs, low maintenance and long cycle life. Favourable compliance adds a further gain. The chemistry pays off when buyers match it to the right application. The four-pillar framework turns that match into a repeatable decision tool. The assess–pilot–scale pathway does the same for rollout. Together they support a near-term decarbonisation pathway for fleets and facilities. Readers should apply the framework to their own operations. They can also contact the team to discuss a pilot.
FAQ
How does sodium-ion cut lifetime costs when the cell price is higher?
A sodium-ion battery carries a roughly 30% higher cell price than LFP. Supply agreements cover about 70 GWh, and rising production scale lowers unit costs. Lower maintenance needs, lower operating costs and a long cycle life offset the premium. Maintenance visits fall. The battery pays back over the holding period.
Which applications suit sodium-ion best?
Electric forklift trucks are strong candidates, and so is other materials handling equipment. A sodium-ion battery handles repeated cycles well. Depot routes and cold stores fit. Operating costs and service costs stay low, and maintenance needs stay low. Maintenance hours fall. The battery lasts.
How does sodium-ion compare with lithium-ion and lead-acid on TCO?
The cell price gap sits near 30%, yet the lifetime total cost of ownership gap reaches roughly 50%. A sodium-ion battery wins on maintenance, service costs and operating costs. Lead-acid suits standby duties. Lithium-ion leads on energy density. Each battery fits a distinct role, and maintenance planning differs by chemistry.
How should a fleet begin a sodium-ion pilot?
Start with a baseline TCO assessment across the four pillars. Application matching follows. Operators pilot a small battery set and record real duty cycles. Electric forklift trucks and other materials handling equipment make good first candidates. Teams log maintenance costs, service costs and maintenance hours. Battery data guides scaling.
What ongoing checks keep the TCO model accurate?
Teams compare real maintenance costs and downtime against the model. Service costs and maintenance hours join the review. Discrepancies trigger a review, not a rushed step. Annual benchmarking against lithium-ion and lead-acid keeps the case honest. Electric forklift trucks supply the first battery data. The battery record grows over time.