

Sodium-ion cell quality is assured through a multi-level framework. Incoming materials, particle, powder, electrode, assembly and cell stages each carry defined checks. Layered testing protects consistency, performance and safety because a defect caught early cannot propagate downstream. Each level targets a distinct failure mode, from raw material impurities to weld porosity. Production delays caused by quality issues damage customer confidence, so Quality Control and Testing Standards must cover every stage rather than the final product alone. Quality is built into the process, not inspected at the end.
Key Takeaways
Test at every stage: catch defects early to save money and keep customers happy.
Each production stage has its own checks for specific problems, from raw materials to final cells.
Early detection prevents small issues from becoming big, costly failures later.
Keep detailed records and certificates to trace problems and ensure quality.
Follow international standards like IEC 62619 to guarantee safety and performance.
Multi-Level Quality Control and Testing Standards
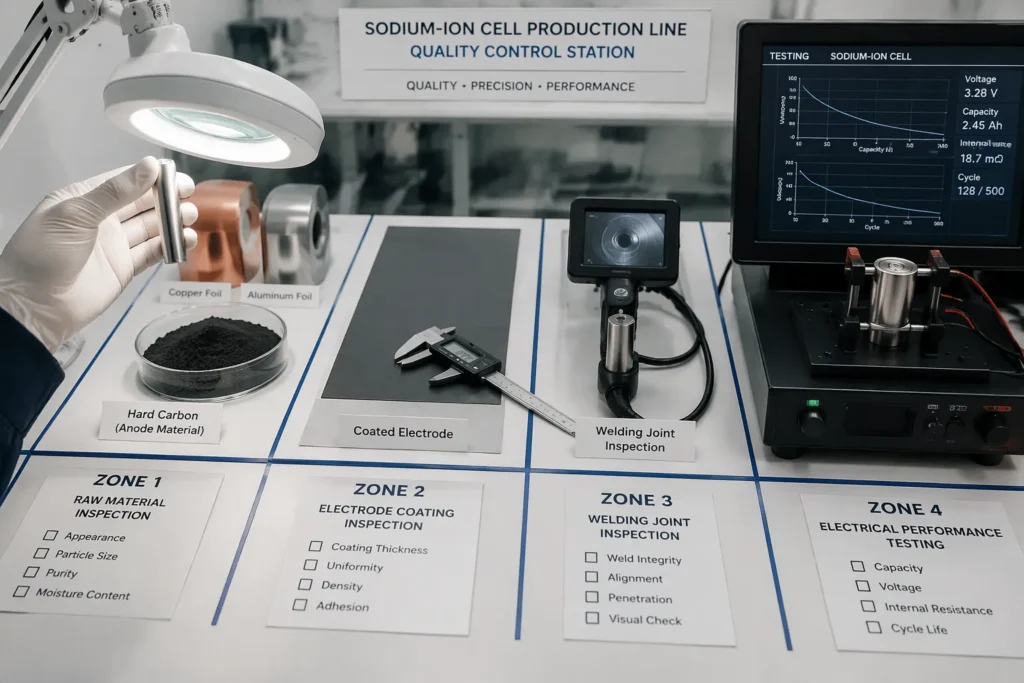
Why Layered Testing Matters
A multi-level framework adapts proven lithium-ion quality control methodology to sodium-ion production. The underlying logic does not change. Each production stage receives its own checks, its own acceptance criteria and its own records. Sodium-ion lines inherit this discipline and adjust the limits to suit different material behaviour.
Quality-related production delays are especially damaging. A missed defect discovered at the cell stage forces a line stop, a batch hold and a customer conversation. That sequence destroys customer confidence far faster than a price increase ever could. Testing protocols should therefore cover all production stages, not only the finished product. A sodium-ion cell production line quality control programme that inspects only at the end inspects too late.
Layered testing also separates failure modes. A particle strength problem looks nothing like a weld porosity problem. Separate checks at separate stages keep the diagnosis clean and the corrective action targeted.
Stage-by-Stage Overview
The framework maps each level to a production stage and a primary failure mode. The table below summarises this mapping.
Level | Production stage | Primary failure mode addressed |
|---|---|---|
Incoming quality control | Raw material receipt | Impurity, off-spec precursor, inconsistent hard carbon |
Particle characterisation | Material preparation | Particle fracture during processing |
Powder resistivity and compaction density | Powder blending and calibration | Poor conductivity, poor processability |
Electrode uniformity and defect detection | Coating and calendering | Coating weight drift, porosity variation, hidden defects |
Assembly quality control | Welding and encapsulation | Weld defects, seal leakage |
Cell performance and safety testing | Formation and final test | Capacity shortfall, thermal or abuse failure |
Each row represents a gate. Material passes the gate or it does not. This binary discipline keeps the line moving and keeps disputes short.
The sequence follows production order for a practical reason. A defect caught at incoming inspection costs a supplier conversation. The same defect caught at formation costs a scrapped cell and a lost shift. Early gates carry the cheapest corrections.
The framework also supports incoming material inspection as a standing routine rather than a one-off event. Suppliers see the same criteria every batch. Buyers see the same data every delivery. Both sides work from one reference.
These Quality Control and Testing Standards form the backbone of the full programme. The sections that follow walk through each level in production order. Each section covers the pain point, the testing method and the acceptance criteria. The final section closes with documentation and audit practices.
Incoming Quality Control and Raw Materials
Raw Material Qualification
Incoming quality control sits at the very start of production. Its job is simple: verify the integrity of every raw material before release to the line. Nothing moves to the mixing room until it passes.
Qualification covers hard carbon 🧦 and cathode precursors 🧪 as separate streams. Hard carbon receives checks on moisture, particle size distribution and ash content. Cathode precursors receive checks on purity, crystallinity and defect rate. Sodium-ion cathode materials demand tighter control over these three properties than lithium-ion equivalents. Small deviations in crystallinity or defect density shift the electrochemical behaviour of the finished cell, so the incoming limits are narrower.
Figure: raw material inspection flow — receipt, sampling, laboratory assay, release or hold.
Incoming Inspection Criteria
A supplier qualifies against a fixed specification. Each delivery then faces sampling and assay against that same specification. Example acceptance criteria include a certificate of analysis matching the approved specification, moisture below the agreed limit, and no foreign matter visible under inspection. These Quality Control and Testing Standards apply to every batch without exception.
Out-of-spec material carries real consequences. A precursor with poor crystallinity can depress first-cycle efficiency across an entire batch. Excess moisture in hard carbon can trigger side reactions during formation. Both outcomes surface late, after coating and assembly costs are already spent. The line therefore holds suspect material at the gate rather than gambling on downstream correction.
Particle-Level Characterisation
Mechanical Strength Testing
Particle fracture during electrode processing degrades electrode quality. A hard carbon or cathode particle that cracks under calendering pressure exposes fresh surfaces, disrupts the conductive network and creates fines that migrate into the electrolyte. The resulting electrode shows uneven porosity and weaker adhesion to the current collector. These defects rarely appear at the particle stage. They surface later as capacity fade or impedance rise, which makes the root cause expensive to trace.
Particle mechanical characterisation for sodium-ion electrodes therefore measures how much load a particle withstands before it breaks. Two methods dominate. The first uses a micro-compression tester, which presses a single particle between flat platens and records the force at fracture. The second uses nanoindentation, which drives a small indenter into the particle surface and derives hardness and elastic modulus from the load-displacement curve. Both instruments report a distribution rather than a single value, because particle strength varies across a batch.
Example results guide the process setting. A batch that fractures at low compression force signals a need to reduce calendering pressure or revisit the synthesis route. A batch with a tight strength distribution supports stable line operation.
Acceptance Criteria
Acceptance criteria for particle strength link directly to the downstream process. The specification sets a minimum fracture force that the calendering step will not exceed, with a margin for batch variation. A supplier and a cell maker agree this limit together, because the calendering pressure differs from line to line.
Out-of-spec particles trigger a hold and a review. Weak particles point to synthesis parameters. Excessively hard particles can resist compaction and leave voids in the electrode. Both cases warrant a supplier conversation before release. These checks keep particle quality tied to electrode performance rather than to a laboratory number alone.
Powder-Level Resistivity and Compaction Density
Electrode powders must conduct electrons well and compact predictably. Poor conductivity raises cell impedance and forces formators to compensate with slower, costlier cycles. Poor processability shows up as inconsistent coating weight and variable electrode density. Both problems originate in the powder, before any slurry meets a current collector. Powder-level checks therefore act as an early warning for the coating line.
Resistivity Measurement
Electrode powder resistivity measurement typically uses a four-point probe applied to a powder sample held under controlled pressure. The instrument reports resistivity as a function of applied load, because powder conductivity changes sharply with compaction. A second common method presses the powder into a pellet of fixed mass and measures resistance across the pellet. Both approaches produce a curve rather than a single figure, and the line compares that curve against the qualified reference for the approved material.
Typical target values are set per material grade and agreed between supplier and cell maker. A hard carbon grade with a higher graphitisation degree conducts better than a low-temperature grade, so a single limit across all grades would be meaningless. The acceptance criterion is therefore a band around the qualified reference curve. A batch that drifts outside the band signals a change in precursor source, synthesis temperature or carbon coating. The line holds the batch and requests a supplier review before release.
Compaction Density Targets
Compaction density of sodium-ion electrode powder governs how much active material fits into a fixed electrode volume. The test presses a known powder mass at a defined load and calculates density from the resulting pellet thickness. The result predicts the electrode density the calender can achieve and the porosity the finished electrode will retain.
Targets follow the cell design rather than a universal figure. A high-energy design pushes for higher compaction density, while a power-oriented design accepts lower density to preserve pore structure for electrolyte transport. The specification sets a window, and the line tracks batch-to-batch drift within that window. A downward drift warns of harder particles or a changed particle size distribution. Either cause will disturb calendering and coating uniformity downstream. Early detection at the powder stage keeps the correction cheap.
Electrode-Level Uniformity and Defect Detection
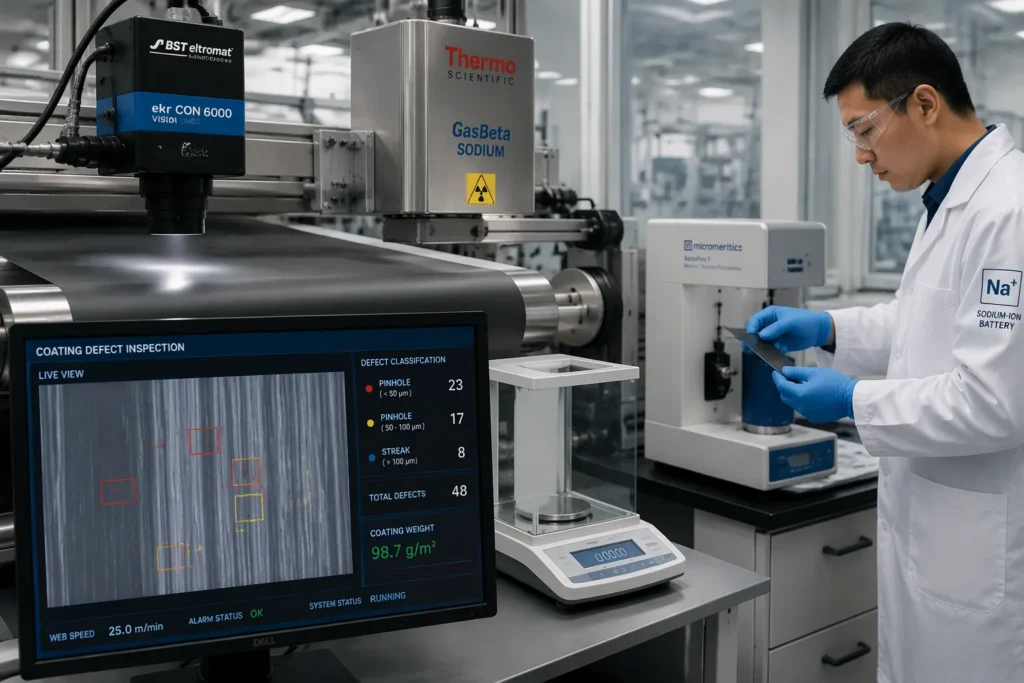
Coating variability and hidden defects form the central pain point at this stage. A coating weight that drifts across the web changes the local balance of active material and conductive additive. The cell then delivers uneven capacity, and the weakest area sets the limit. Hidden defects are worse. A pinhole or a streak passes a casual visual check and fails only after formation, when the scrap cost is highest.
Coating Weight and Porosity Checks
Coating weight checks use an inline beta gauge or X-ray gauge that scans the coated web and logs weight per unit area across the full width. The line compares each reading against the qualified target and flags any drift beyond the agreed band. Operators sample the web at defined intervals and confirm the inline reading with a laboratory balance. Porosity follows from electrode density, which the line derives from coating weight, true material density and caliper thickness. A mercury intrusion or gas pycnometry test on coupons confirms the result offline.
Acceptance criteria set a window around the qualified coating weight and a matching window for porosity. A roll that drifts outside either window goes on hold. Example results from a stable line show coating weight holding within its band across the full roll length, with porosity tracking the target. A drifting roll typically shows a gradual weight change from one edge, which points to a die or slurry issue.
Figure: common electrode defects — ⚠️ coating streaks (edge drift, moderate severity), ⚠️ pinholes (bare spots, high severity), ✅ uniform coating (pass).
Defect Detection Methods
Defect detection combines optical inspection with electrical and physical checks. An inline camera system scans the coated and calendered electrode for pinholes, streaks, scratches and metal particles, and it classifies each find by size and type. The line then applies a rule: defects above the agreed size limit mark the affected area as scrap. Smaller defects pass with a recorded note. These Quality Control and Testing Standards keep the classification consistent from shift to shift.
A hipot or insulation test on the finished electrode catches pinholes that optical systems miss. Physical checks confirm adhesion and flexibility on coupons. Example results show a clean roll passing optical inspection with no defects above the size limit and a hipot test with no breakdown. A roll with a detected streak shows a localised hipot failure, which confirms the optical finding and justifies the hold.
Assembly Quality Control
Weld Inspection
Weld inspection belongs in every quality control process for sodium-ion cell production. A weak weld raises joint resistance, and the cell then loses capacity under load. A porous weld can open a leak path that only shows up after sealing. Both faults sit hidden inside the finished cell, so the line must find them at the assembly stage.
Ultrasonic inspection and visual checks under magnification form the standard pair of methods. Ultrasonic testing reads the internal weld nugget and reports voids or incomplete fusion. Visual inspection confirms bead shape, discolouration and spatter. Acceptance criteria require full fusion across the joint area, no porosity visible at the agreed magnification, and joint resistance within the qualified band. A weld that fails any criterion goes to rework or scrap. These Quality Control and Testing Standards apply to every tab and every can joint without exception.
Encapsulation Quality Control
Quality control during encapsulation is critical. The seal protects the cell from moisture ingress and electrolyte loss for its entire service life. The process must strictly adhere to process specifications, because a small deviation in seal pressure or temperature can create a channel that no later test detects.
Helium leak testing provides the primary check. The line pressurises the sealed cell and measures helium escape rate against the qualified limit. A second method weighs the cell before and after a controlled storage period and flags any mass loss that indicates electrolyte escape. Acceptance criteria set a maximum leak rate per cell and require a clean seal surface with no wrinkles or trapped foreign matter. Example results from a stable line show every cell passing the helium test with a leak rate well inside the limit. A cell that fails goes to quarantine, and the line reviews the sealing parameters before restarting.
Cell-Level Performance and Safety Testing
Formation Testing
Verifying performance and safety at scale forms the central pain point at the cell stage. A single weak cell in a batch of thousands can trigger a field return, and a single unsafe cell can trigger a recall. Cell-level checks therefore combine process control with statistical sampling.
Formation testing sits inside the quality control system rather than after it. The first charge builds the solid electrolyte interphase and reveals defects that earlier gates missed. The line records capacity, coulombic efficiency and internal resistance for every cell during formation. Cells that fall outside the qualified band go to quarantine before they reach grading. These Quality Control and Testing Standards link the formation data back to the electrode and powder records, so an engineer can trace an outlier to its coating roll.
Electrical, Thermal, and Abuse Testing
Electrical tests confirm capacity, rate capability and self-discharge against the qualified specification. Thermal tests check behaviour across the operating temperature range and record any abnormal heating during cycling. Abuse tests cover overcharge, external short circuit, crush, nail penetration and thermal propagation. The line references IEC 62619, the international standard for safety requirements of industrial secondary lithium cells and batteries, which testing bodies now apply to sodium-ion cells as well. The IEC 62619 standard page sets out the test conditions and pass criteria that auditors expect to see.
Acceptance criteria follow the standard and the customer specification together. A cell passes electrical testing when capacity and resistance sit inside the agreed band. A cell passes abuse testing when it shows no fire, no explosion and no leakage beyond the defined limit. Example results from a stable line show formation efficiency clustered tightly around the qualified value, with only a small tail of outliers routed to quarantine. Abuse samples from the same batch complete nail penetration without thermal runaway.
Figure: cell test bench setup — 🔋 cells loaded into the formation rack, ⚡ abuse chamber ready for nail penetration and overcharge runs.
Documentation, Standards, and Audits
COA, TDS, and Traceability
Paperwork closes the loop on every physical check. A cell-level Certificate of Analysis (COA) and a Technical Data Sheet (TDS) should accompany each batch, and both documents must carry the batch number. Buyers should require these documents before any deposit is made. The COA records the measured results against specification. The TDS states the qualified performance envelope. Together they let a buyer confirm what the line actually produced, not what the sales team promised.
Traceability depends on linked records. The batch number on the COA should point back to the coating roll, the powder lot and the incoming material delivery. An engineer can then trace an outlier cell to its source in hours rather than weeks. This record chain turns a single failure into a corrective action with a known address.
IEC Standards and Line Audits
Auditing a production line should include a review of the line itself and its test data before bulk orders proceed. The auditor watches the process run, checks the gauges and reads the records. International standards such as IEC 62619 give the audit a fixed reference for safety test conditions and pass criteria. A line that meets the standard and holds its data ready passes a far smoother audit.
Documentation supports continuous improvement across three functions. Research and development uses the data to refine material and electrode design. Manufacturing uses it to set in-process controls and acceptance criteria. Quality management uses it to run audits and track trends over time. These Quality Control and Testing Standards therefore serve as a shared language for all three teams.
The multi-level framework links incoming material properties to final cell performance. Each gate passes data forward, so a coating drift traces back to a powder lot and a formation outlier traces back to a coating roll. Quality is built in at each stage rather than inspected at the end.
The same framework serves three teams. Research and development uses the data to guide material and electrode design. Manufacturing uses it to define in-process controls and acceptance criteria. Quality management uses it for traceability, audits and continuous improvement. These Quality Control and Testing Standards give all three a shared reference.
Standardisation work for sodium-ion testing continues, and testing bodies increasingly align sodium-ion methods with established IEC frameworks.
FAQ
Why does a sodium-ion cell production line test at several stages instead of only at the end?
A defect caught at incoming inspection costs a supplier conversation. The same defect caught at formation costs a scrapped cell and a lost shift. Layered gates keep corrections cheap and diagnoses clean, because each stage targets a distinct failure mode.
How does sodium-ion cathode material control differ from lithium-ion practice?
Sodium-ion cathode precursors demand tighter limits on purity, crystallinity and defect rate. Small shifts in crystallinity or defect density change the electrochemical behaviour of the finished cell. Incoming specifications therefore set narrower windows than comparable lithium-ion materials require.
What happens when hard carbon particles fracture during calendering?
Fractured particles expose fresh surfaces, disrupt the conductive network and release fines into the electrolyte. The electrode then shows uneven porosity and weaker adhesion. Particle strength testing sets a minimum fracture force that the calendering step must not exceed.
Which checks confirm weld and seal integrity during assembly?
Ultrasonic inspection and magnified visual checks confirm full weld fusion and flag porosity. Helium leak testing then measures the escape rate of each sealed cell against a qualified limit. Cells that fail either check go to rework, scrap or quarantine.
Which documents should a buyer require before placing a bulk order?
A cell-level Certificate of Analysis and a Technical Data Sheet should accompany each batch, and both must carry the batch number. Auditors also review line and test data against IEC 62619 before bulk orders proceed.